BEGINNER
“I don't know what data to even look at.”
Largest segment. Doesn't have data literacy yet. Wants to be told what matters.
+ 01 / Intro
Advanced Reporting
Designed the report. Designed how it would be measured. Then refused to read low usage as failure.
+ State
02
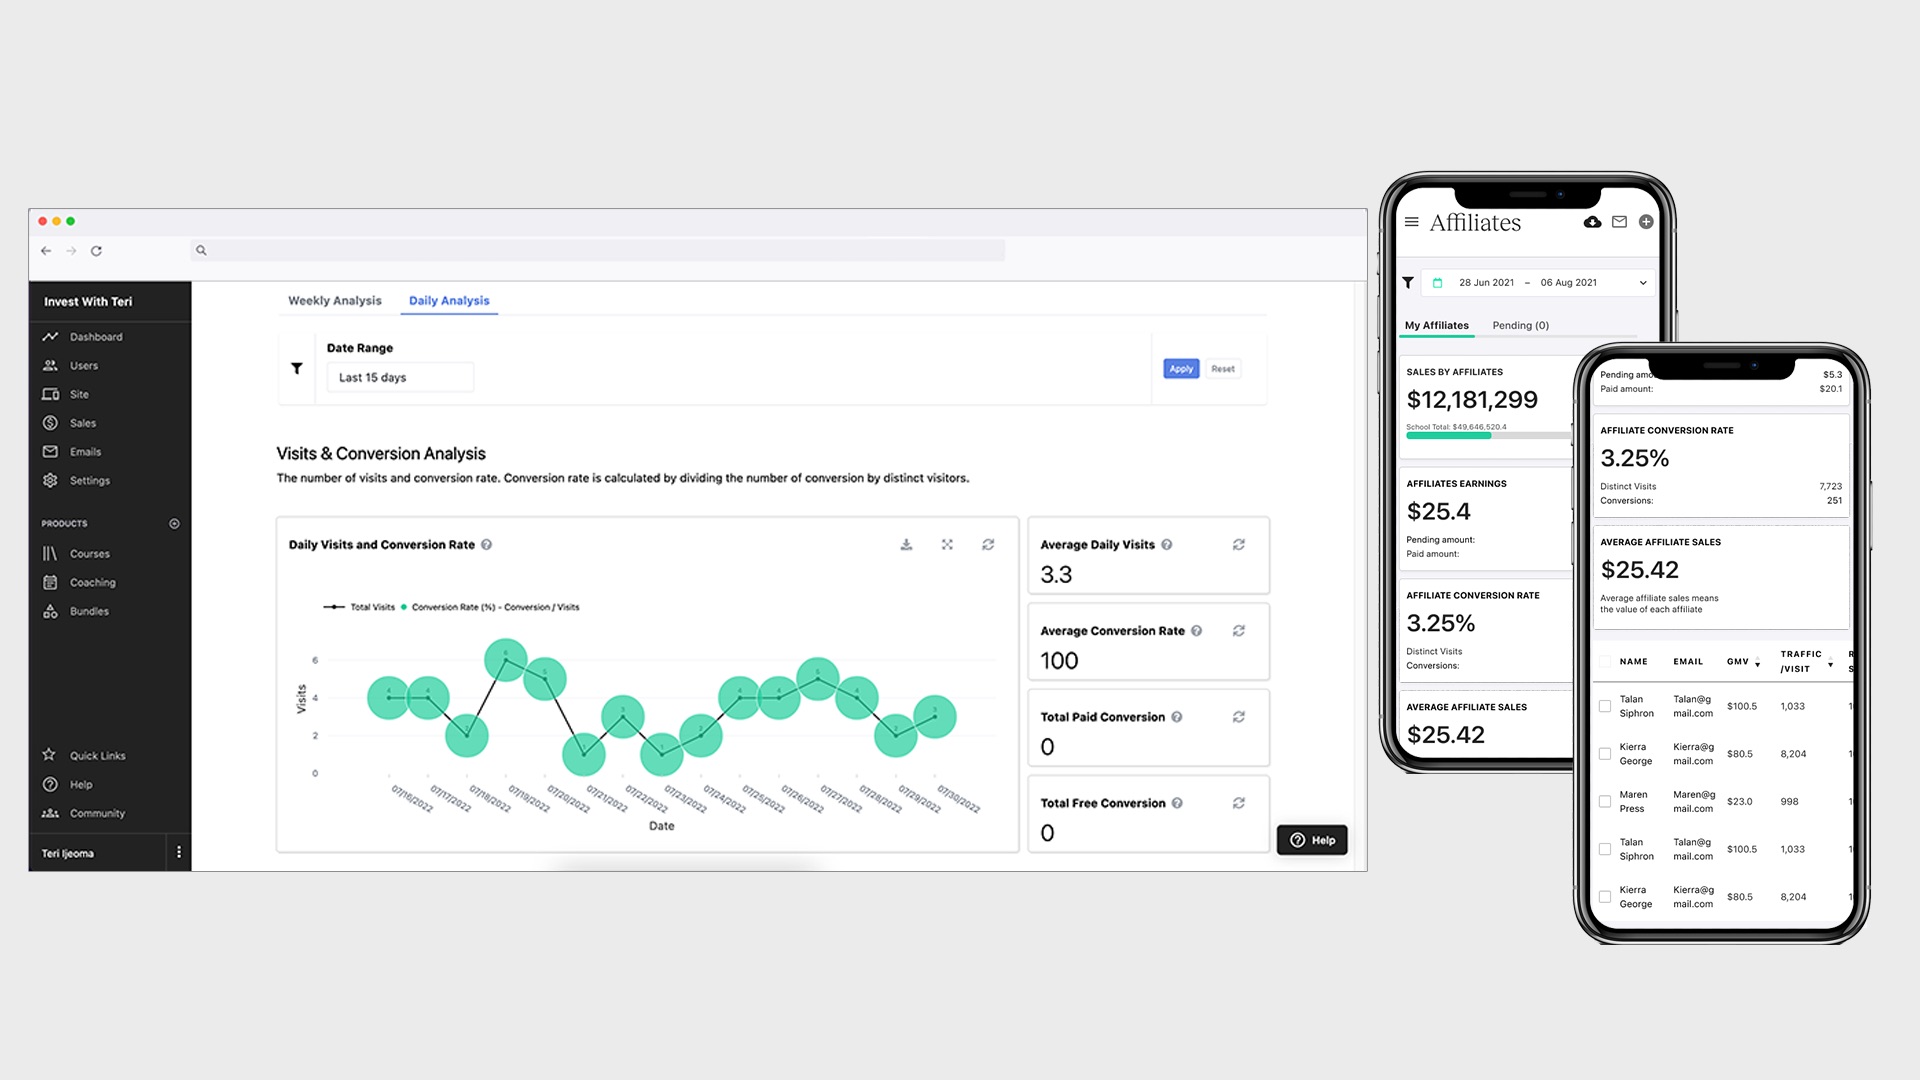
When I joined Teachable, school owners were running creator businesses without numbers. The workaround everyone landed on: a separate Squarespace or WordPress site with Google Analytics — plus the persistent worry they'd set it up wrong. The native platform had no dashboard at all.
SCARCITY · what didn’t exist
The cost of zero analytics didn’t land on Teachable. It landed on the schools — extra setup on a second site, hosting bills, configuration anxiety. And the revenue tie ran straight back: Teachable’s subscriber business is downstream of school success. When schools can’t read their own numbers, they can’t grow, retention dips, and the platform loses the upside of its own creators getting bigger. A native dashboard wasn’t a quality-of-life feature. It was a growth lever Teachable didn’t have yet.
+ Scope cut
03
For the design decision I worked from proto-personas — three hypotheses about data literacy and needs — and ran lo-fi sketches against them. The aim wasn't to confirm the personas. It was to find out which one V1 had to be designed for, and which one it couldn't.
Proto-personas · three hypotheses about data literacy
BEGINNER
“I don't know what data to even look at.”
Largest segment. Doesn't have data literacy yet. Wants to be told what matters.
INTERMEDIATE
“I only need numbers and statistics based on date range.”
The core. Knows the metrics they want, just needs them in one place without fighting for them.
ADVANCED
“I want to know which one has been successful.”
Marketing-fluent. Uses UTMs. Wants attribution and drilldown.
Three lo-fi sketches · one per persona’s ceiling
OPTION 01 · CHOSEN
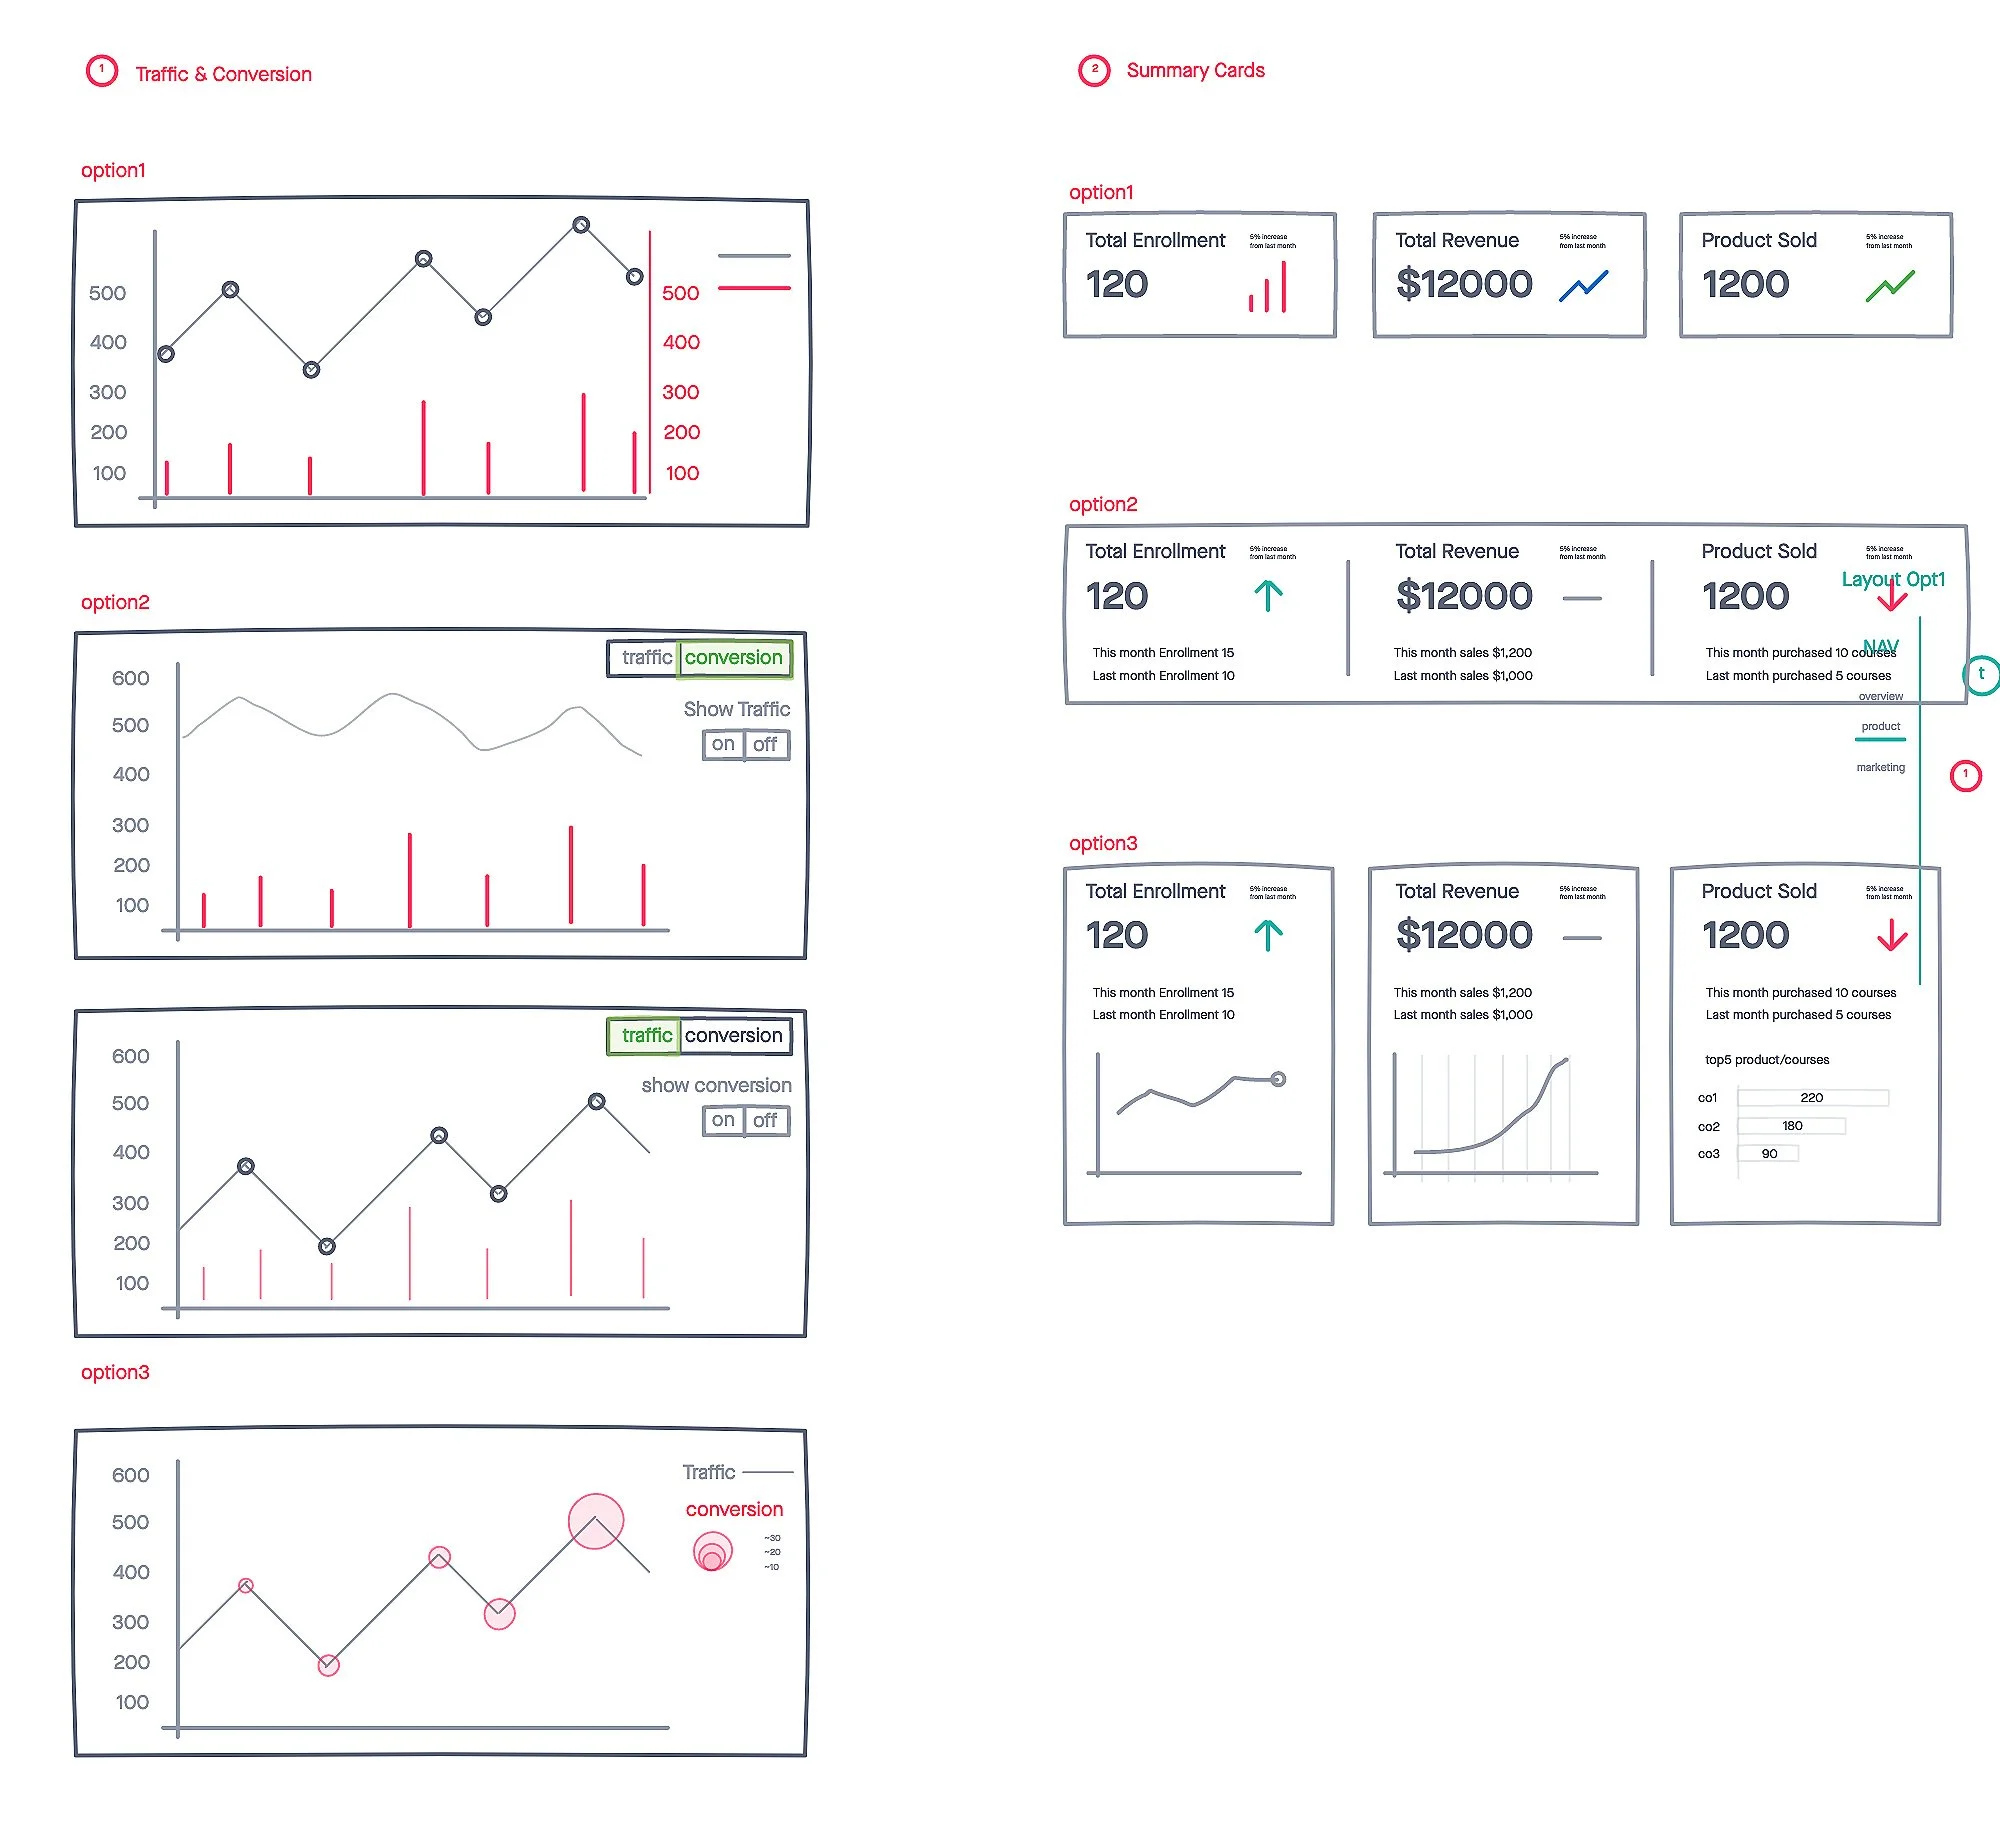
School-level traffic + conversion overlay. The most universal metric set across all 40K schools.
OPTION 02 · DROPPED
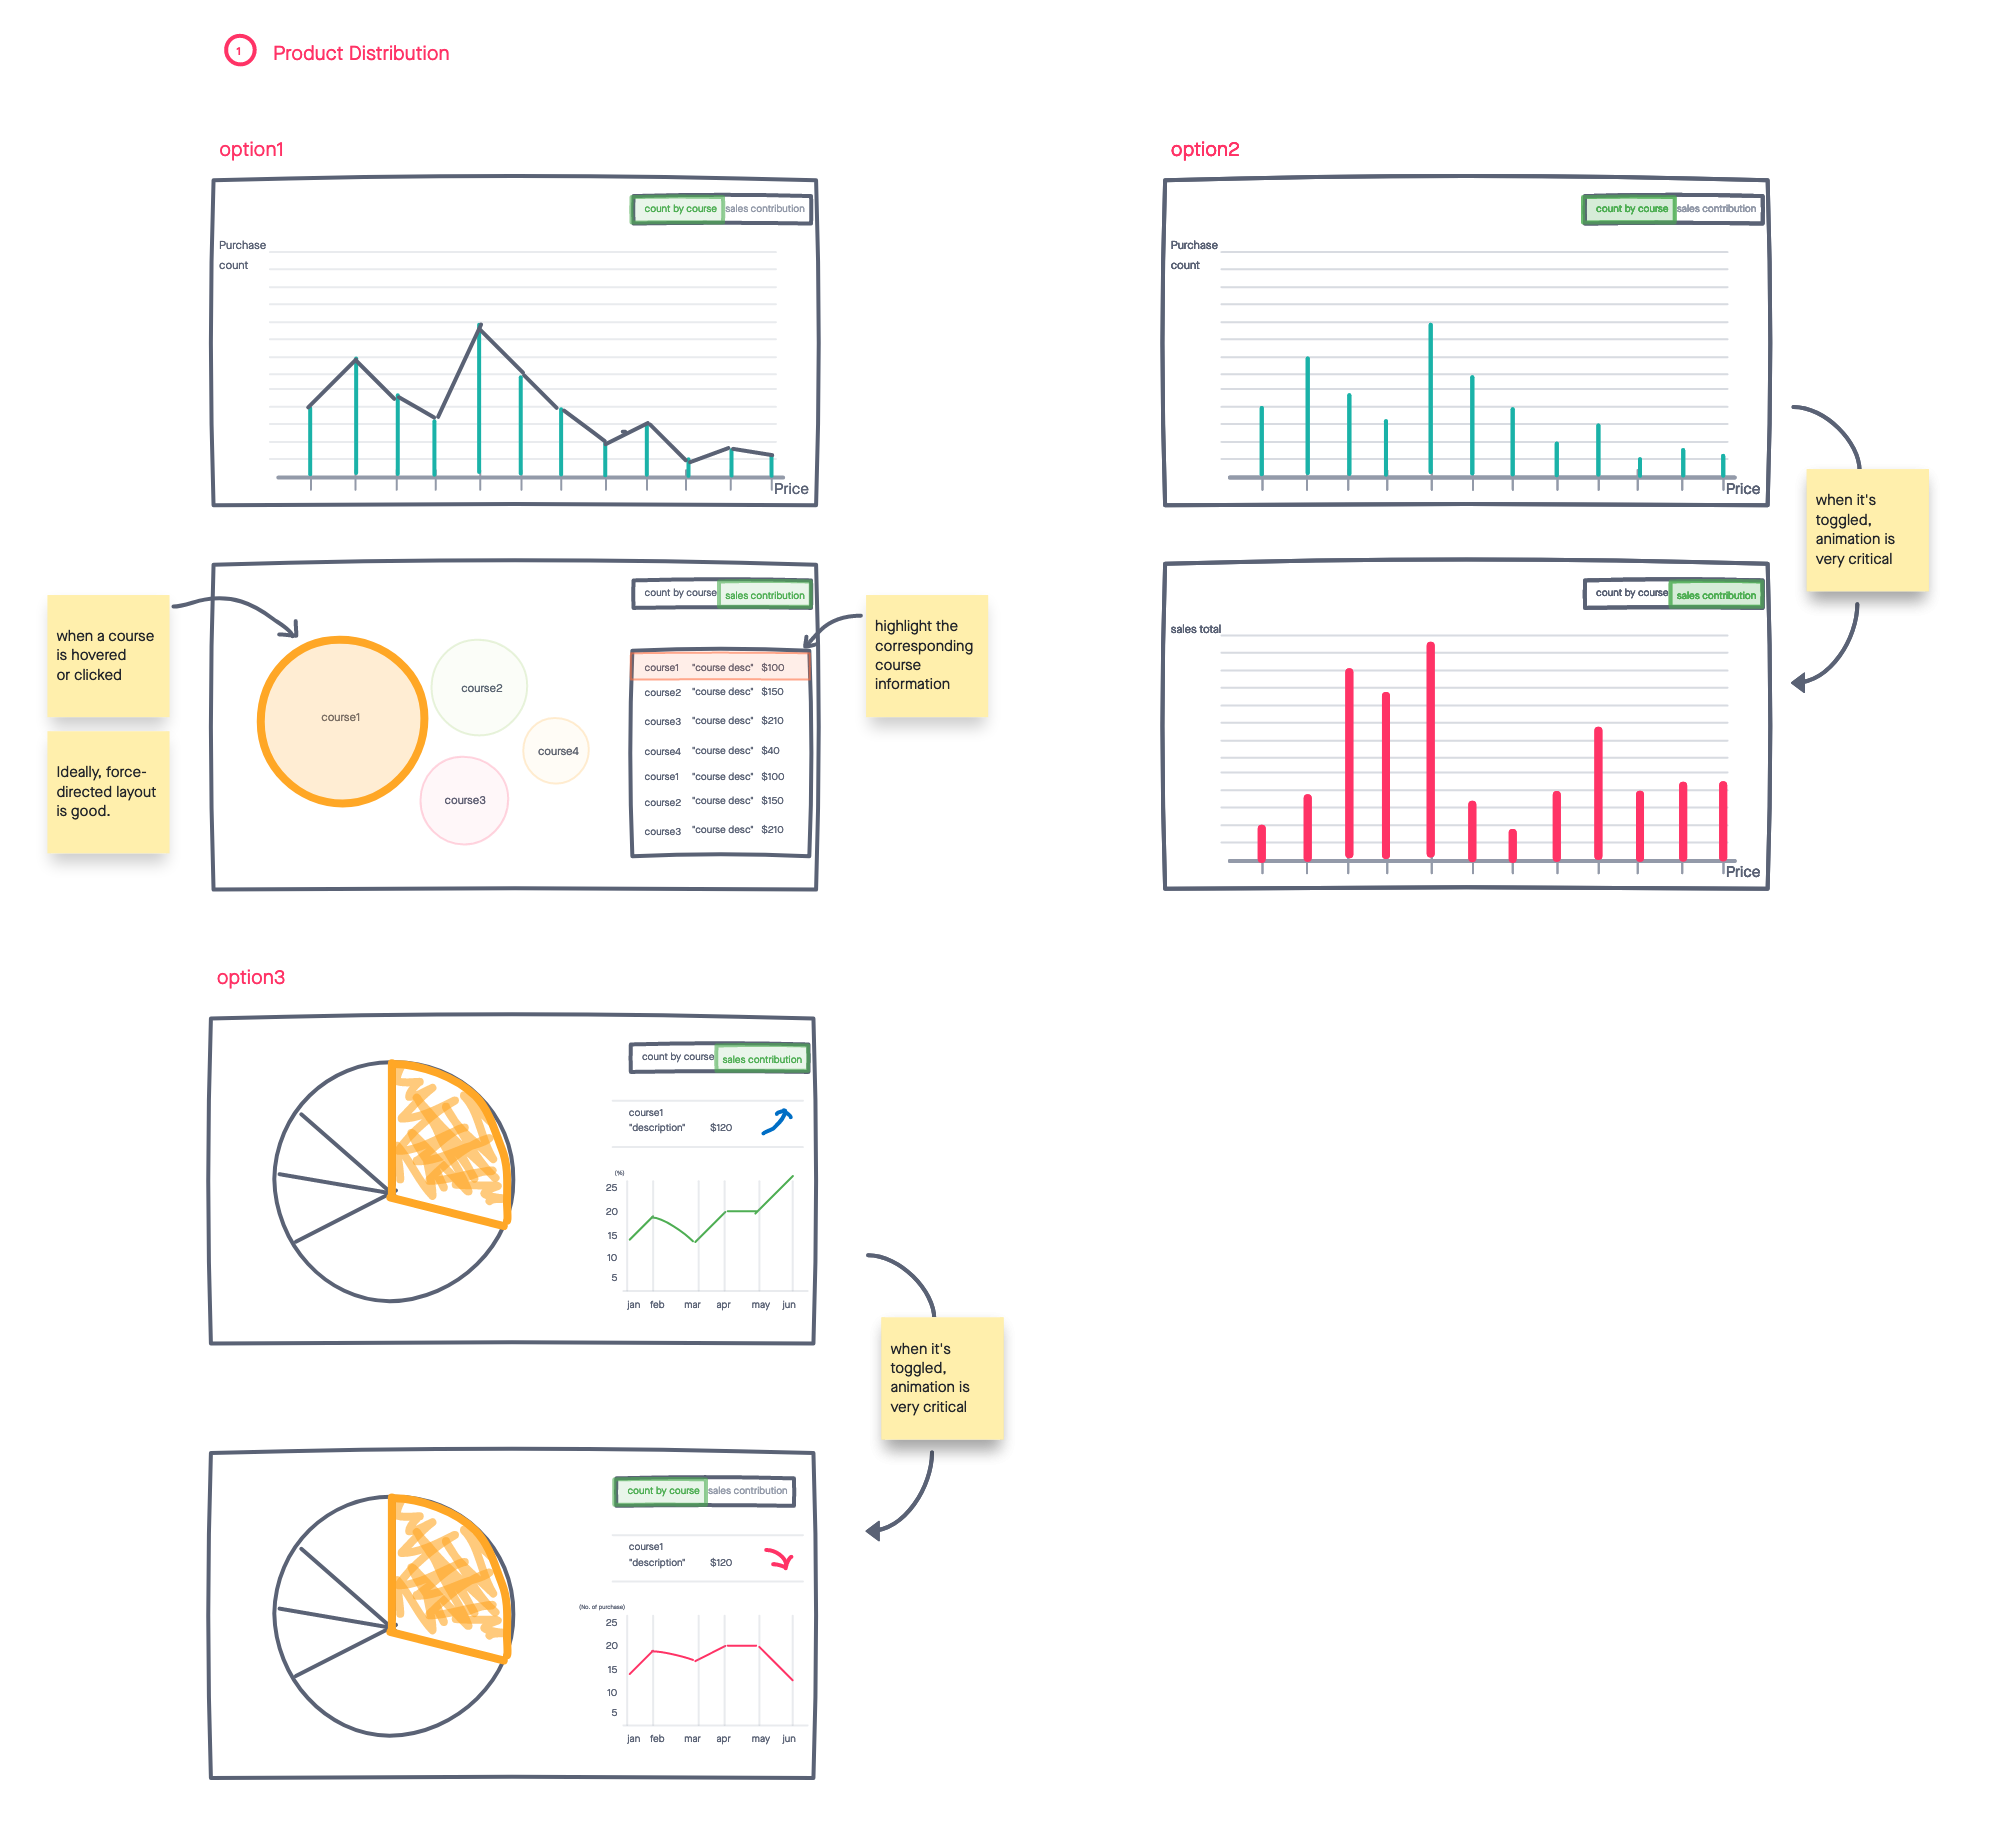
Per-course performance. Useful, but courses already had a separate sales view.
OPTION 03 · DROPPED
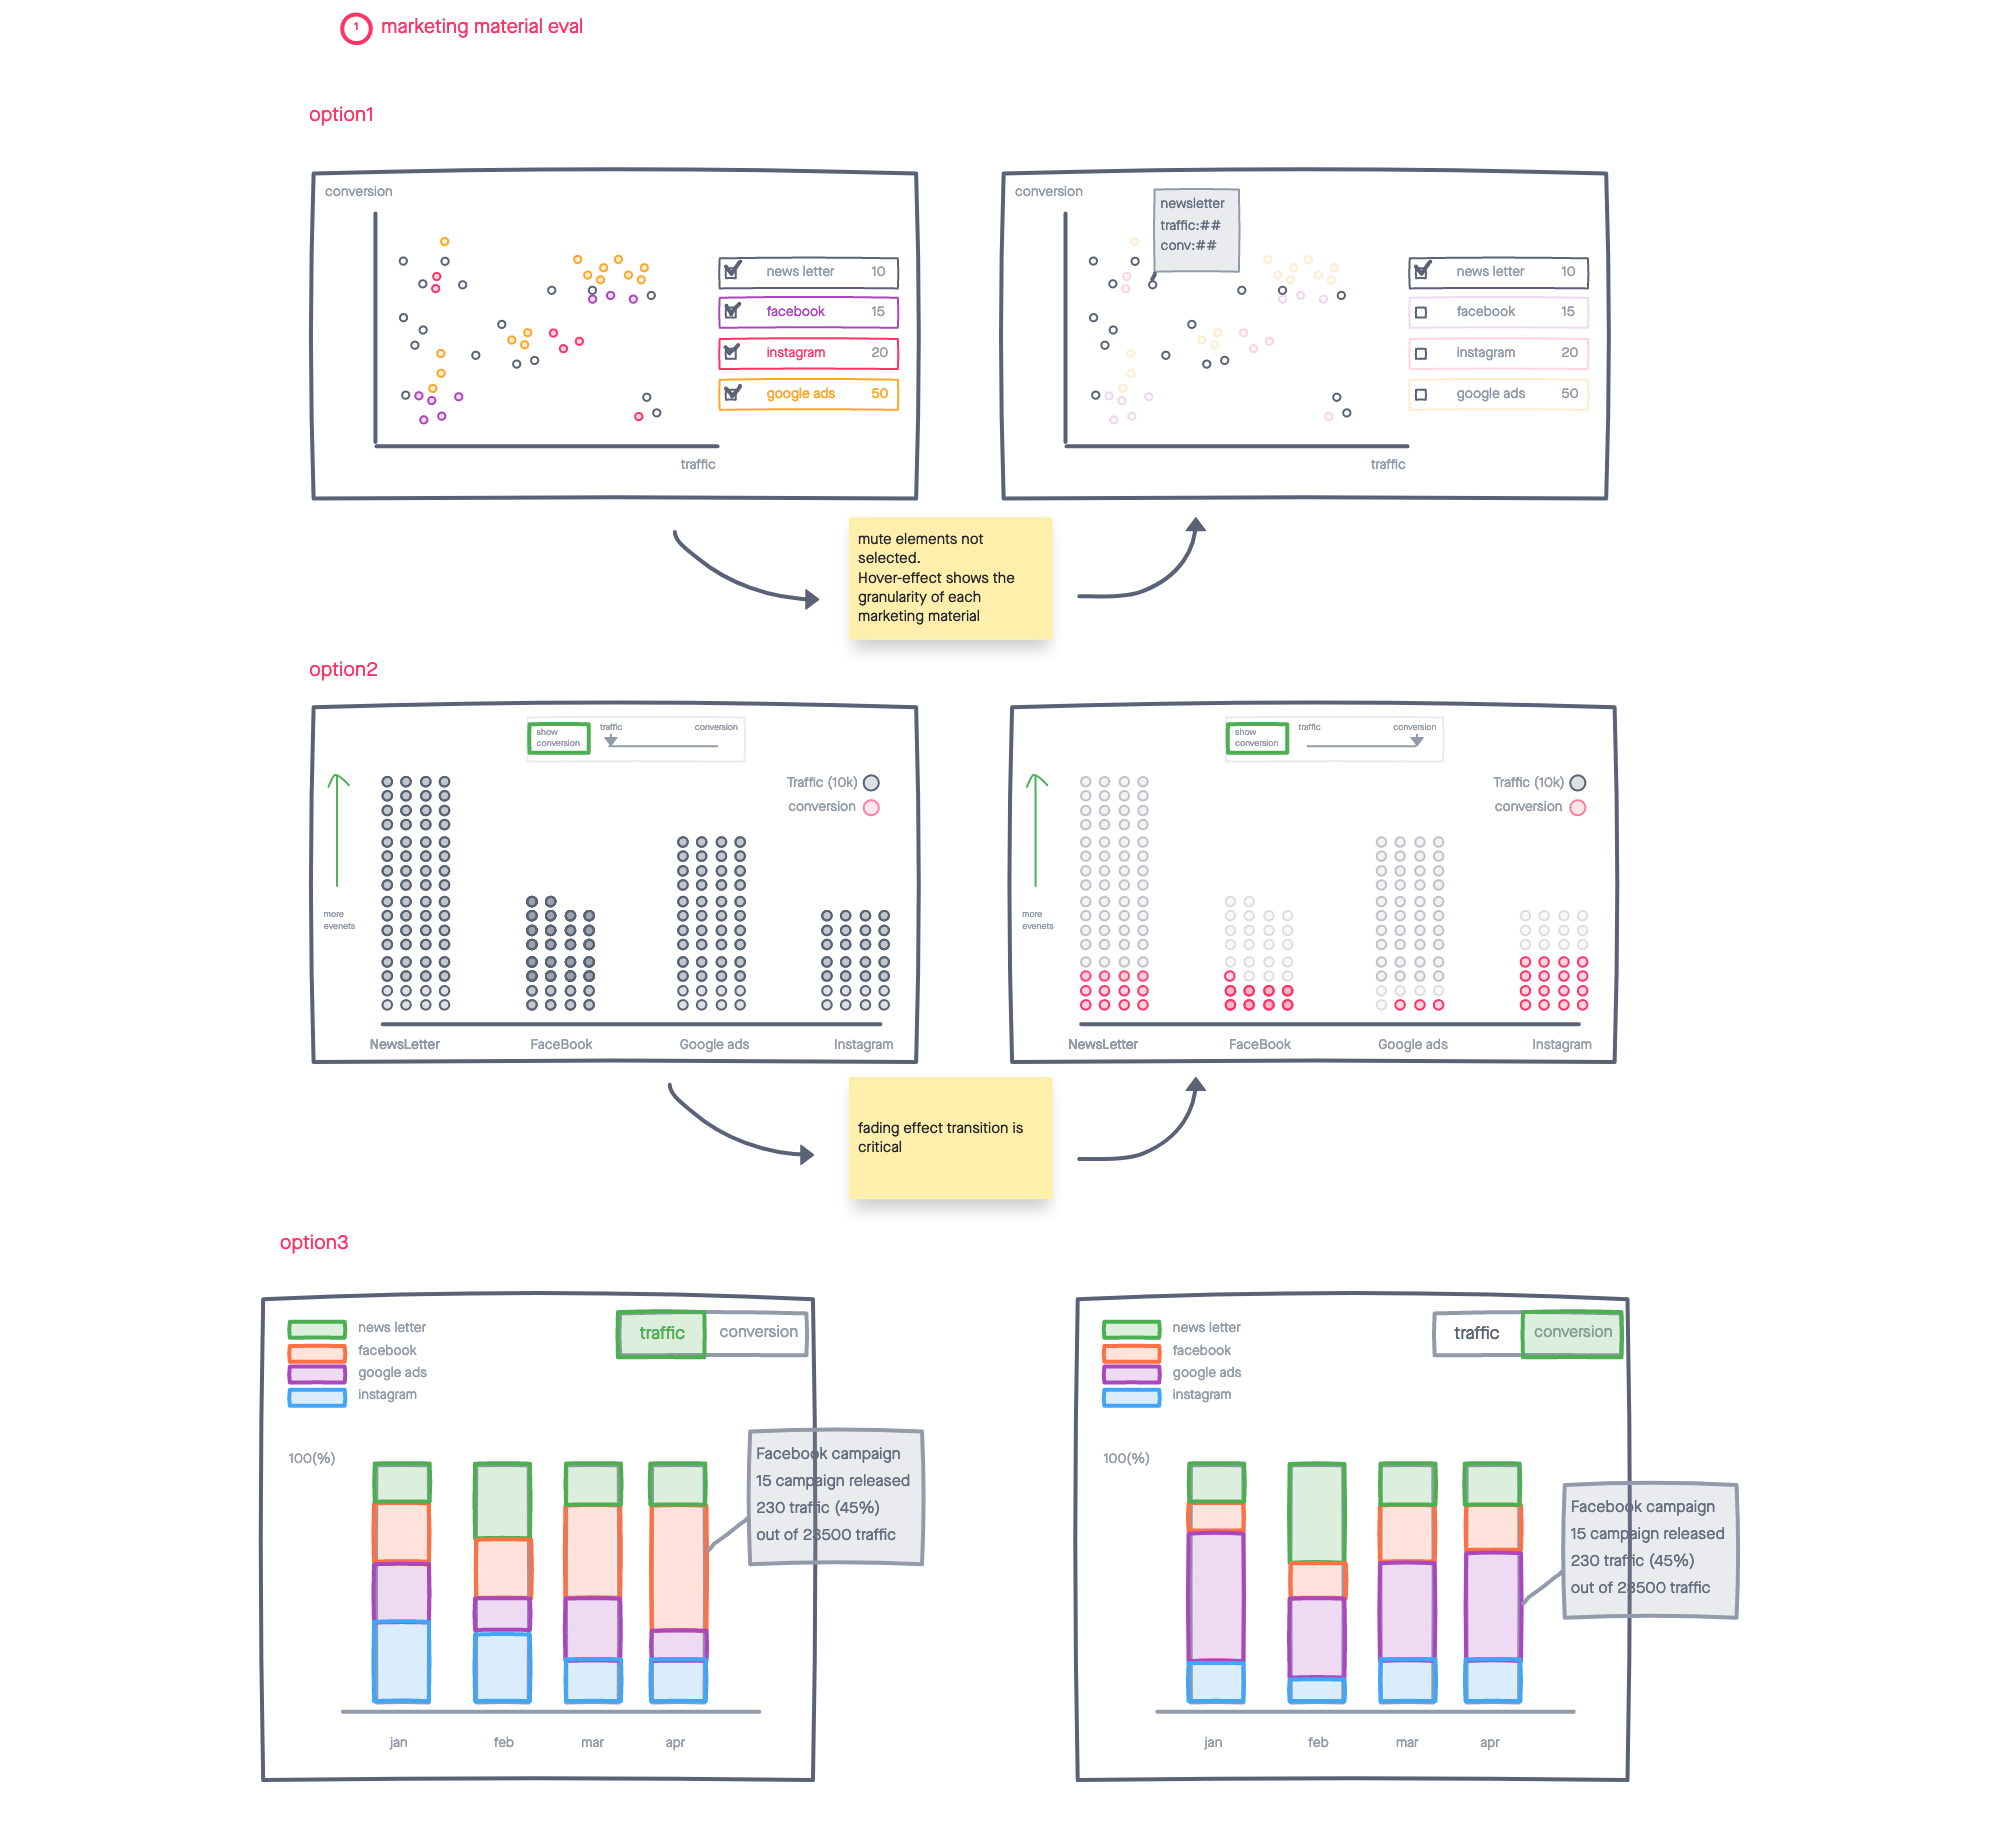
UTM attribution + campaign-level analytics. Powerful — but only ~5% of schools used UTMs.
PERSONA / CUT · WHY
V1 shipped Traffic & Conversion at the school level — the only metric set applicable to all 40K schools. Scoping is design, not roadmap deferral.
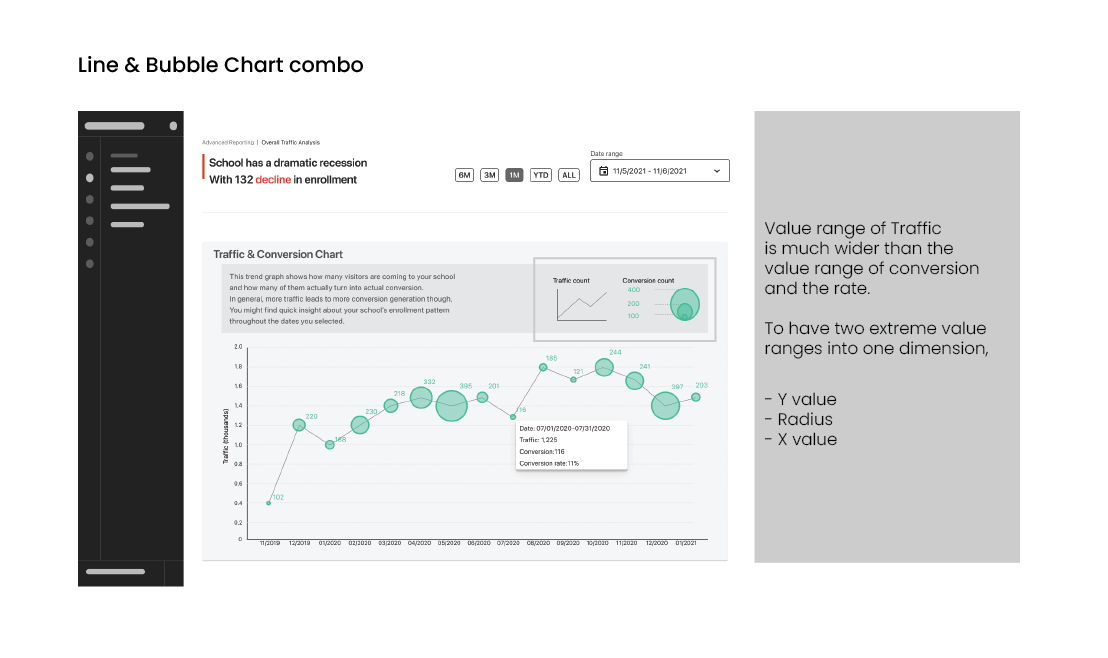
DECISION · VISUALIZATION
Traffic moves in tens of thousands; conversion moves in single-digit percentages. Plotted on the same chart, one of them disappears. Bubble (traffic volume) + Line (conversion rate) keeps both legible — the bubble carries volume, the line carries rate, the timeline ties them together.
Why: the real design decision wasn’t which chart type. It was deciding both metrics had to live in the same eyeline, and then engineering a chart that wouldn’t sacrifice one for the other.
Top finding:5 of 7 participants misread the bubble as “free conversion only” — labels rewritten before alpha. Task 5 was the hardest at 43% success: the free-vs-paid conversion ambiguity inside the tooltip.
+ Instrumentation
04
A school's business doesn't change visibly day to day — daily-active would have been the wrong yardstick. Weekly was the right one. If a school owner walked back in even once a week, the dashboard had pulled them in at the moment something was worth checking. Once-a-week return = signal. The score had to count weekly returns, not session minutes.
Fig. 2 of 3 · Engagement score formula · the binary contract
ENGAGEMENT SCORE · DESIGNED BEFORE ALPHA
1+ visit during a given week → +1 to school’s score
Over the 4-week alpha period · max possible score: 4
SUCCESS THRESHOLD
score > 2
visited at least 3 of 4 weeks · if hit → ships to all 40K · if not → re-scope
The score wasn’t a measurement I’d hand to PM after launch — it was the contract written before launch. If score > 2, ship to all 40K. If not, re-scope.Writing the criteria I’d be judged against, before the code shipped, is the part of the role nobody hires you to do but everybody hires you for.
+ Reframe
05
Alpha results came in declining week over week. By the engagement score I'd designed, the launch looked like a slow failure. Then I read the same data a second way.
78% of schools used the product in week 1
58% returned in week 2
engagement decreased steadily through week 4
Does the lower visits mean lower value? What drove the decline?
Fig. 3 of 3 · The reframe chart · same data, second reading
WEEKLY ACTIVE SCHOOLS · ALPHA · 4 WEEKS
First reading (engagement score): a declining curve. Looks like fading interest.Second reading (event-trigger overlay): each spike maps to a school event — course launch, BOGO promo, seasonal sale.
Each spike maps to a school event — new course launch, promotion, seasonal sale. Usage isn’t weekly. It’s launch-triggered.
Participant 2 had asked for course-launch and campaign-release date markers during usability testing — three months before alpha. The reframe was visible in the room before it was visible in the data.
87%
FINAL ENGAGEMENT · vs previous 20% · 4.4× lift
The dashboard’s job wasn’t to be checked daily. It was to be there when the event triggered.
WHAT THE REFRAME TAUGHT
The bigger move: I wrote the metric. I watched the metric say fail. I refused. The data through a different lens — event triggers — already showed success. The interpretation move IS the senior move. Not the chart. Not the build. The reading.