GOAL 01 / VOCABULARY COUNT
Unique word count by decade
If a decade's lyrics use diverse vocabulary, then despite the raw word count, the count of unique words will be smaller than the raw word count. Track how this gap shifts over time.
+ 01 / Intro
I asked the lyrics how many words they needed.
— a quantitative analysis on hip hop lyrics, 2021
+ The question
02
I'm an ESL speaker. Listening to hip hop, I kept landing on the same feeling: this is the most word-driven music genre I'd encountered. To follow it — really follow it — how much vocabulary do you actually need? And is that vocabulary widening or narrowing over time?
GOAL 01 / VOCABULARY COUNT
If a decade's lyrics use diverse vocabulary, then despite the raw word count, the count of unique words will be smaller than the raw word count. Track how this gap shifts over time.
GOAL 02 / DIVERSITY
Measure how concentrated lyrical content is in the top X% most-used words. Higher concentration = lower diversity. Compare across decades.
Fig. 1 · Data pipeline · API → pre-process → render
STEP 01
Genius API
Top hip hop artists + their top tracks' lyrics
Node.js + Axios
STEP 02
Pre-process
Top 10 songs / artist · per-decade JSON snapshots
Node.js
STEP 03
Render
Scroll-lazy · svg for small, canvas for large
d3.js + canvas + gsap
Most of the work was the pipeline. The visualization is what people see; the scrape and the API loops are what made the visualization possible. Two days of scraping for two seconds of dispersion animation.
+ The atmosphere
03
A standard answer to “what does the data show” is a bar chart. The standard answer is correct and almost always lifeless. The decision here was to treat the visualization as an immersive experience — decades became rooms, the navigation became a cassette deck, the entrance became a luminosity fade like a club door opening. The atmosphere isn't decoration. It's information. The user feels time passing because the room changes around them.
Luminosity transition as the entry sequence. The fade-in isthe door — by the time you can see the chart, you're already inside.
NOW PLAYING / REWIND / PLAY-PAUSE / EJECT — analog cassette grammar borrowed for digital data. Each decade is a room. Tap the switch, the air changes.
The full word field — every word from every track in the dataset, rendered to canvas because svg would have crashed the browser. Decoration that's also a stress test.
Three design moves served one decision: time should feel like a place, not an axis. The case for atmosphere as evidence is the case that information design has feelings too — and that letting them in doesn't soften the data, it lands it.
+ The findings
04
Two findings, both clearer with each successive decade.
FINDING 01 / COUNT
Across notable artists from the 80s through the 10s, the count of unique vocabulary used in top tracks decreased decade by decade. Hip hop got more homogeneous — fewer distinct words, more shared vocabulary. Early hip hop demanded a larger dictionary to follow; later hip hop didn't. The chart kept playing; the dictionary kept shrinking.
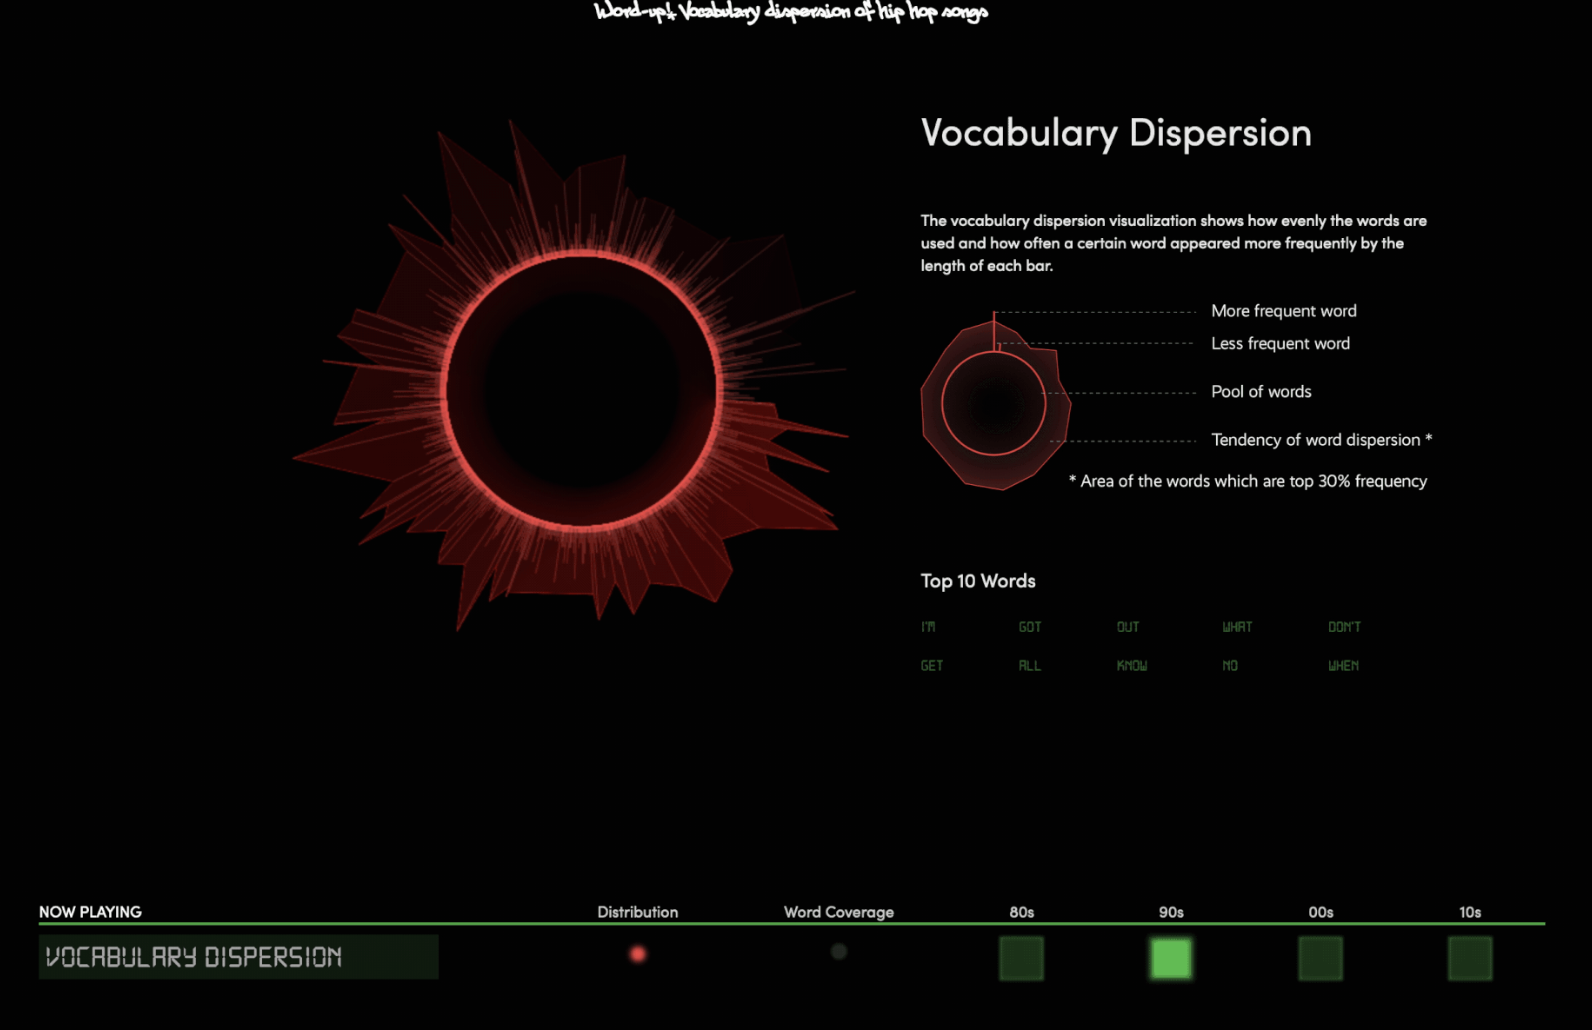
FINDING 02 / DISPERSION
The dispersion sun-burst measures how concentrated lyrics are in the top X% of words. Across decades, the high-frequency words rotate — trendy slang rises and falls — but the words that fade out almost never come back. New vocabulary cycles in; old vocabulary leaves the room and doesn't return.
Net: early hip hop required more vocabulary to listen to. By the 2010s, a smaller word set carried more songs. The chart room cooled down over the decades. We kept dancing to it.
Three muscles trained here that show up in everything after: end-to-end data fluency (scrape · API · pre-process · render), narrative scaffolding around quantitative findings (a finding is a sentence, then a chart), and the conviction that aesthetic is evidence (the club is the chart). VoltHop's iteration ladder and POMEs' reframing both descend from this project's basic move — answer your own question, all the way.
live demo · jotnajoa.github.io/wordup (desktop only)